Let's create a special linetype for use with large overhead utility lines.
A line that looks something like this.

You can tinker with the size of the symbol and the exact spacing to get it looking exactly like you want.
First things first. You will need to define a Text Style. The reason we do this is because the tower symbol you see in the line is actually the capital "T" in a CAD font that comes with CG Software. The font file is called symap.shx
To define the text style, go to the Format Menu and select Text Style.
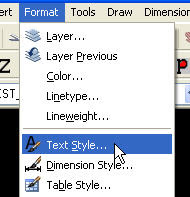
The Text Style Dialog box will come up.
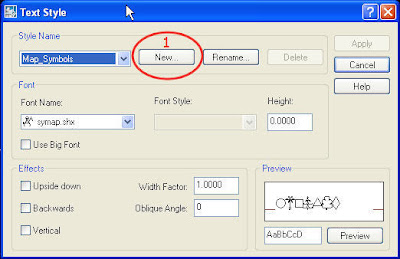
Creating a new Text Style is a 4 step process.
Step 1. Select the NEW style button.
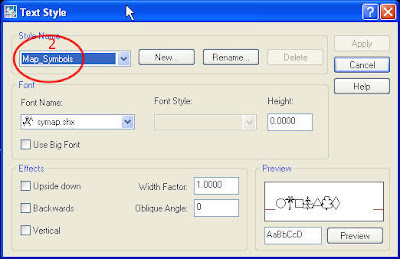
Step 2. Name the new style Map_Symbols
(It is very important that you spell this exactly
this way so you can copy and paste the text
located at the end of this tutorial.)
(It is very important that you spell this exactly
this way so you can copy and paste the text
located at the end of this tutorial.)
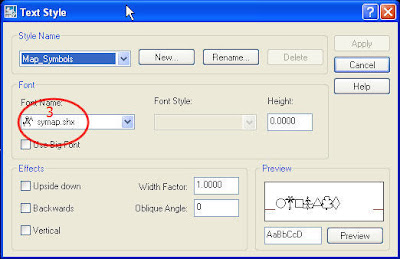
Step 3. Choose the Font Name you want associated with this Text Style.
(Be sure you choose symap.shx from the list.)
(Be sure you choose symap.shx from the list.)
Step 4. Apply the changes then close the dialog box.
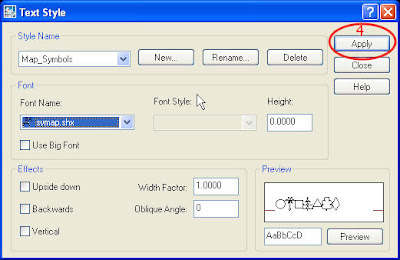
Now that you have the text style properly defined you are ready to work with the linetype definition file.
First you need to determine exactly where your linetype file is stored on your system. To do this go to the Format Pulldown menu and choose Linetype.

This should pull up the Linetype Manager Dialog box. Once there choose the Load button.

This will bring up the Load or Reload Linetypes Dialog box.
You will see the name of a line type file (extension lin) next to a button labeled File.
Choose the File button.
You will see the name of a line type file (extension lin) next to a button labeled File.
Choose the File button.

You can work with any linetype file you wish.
CG Survey 9 users should look for one called "CGSurv_9.lin"
Users of other versions should see a file with a similar name.
CG Survey 9 users should look for one called "CGSurv_9.lin"
Users of other versions should see a file with a similar name.
Pay attention to where this file is stored on your system.
We will need to open that file and make some changes.
We will need to open that file and make some changes.

Once you know the exact file name and data path
we are ready to open the file and make some changes.
we are ready to open the file and make some changes.

As I mentioned in the previous post, be sure and open this file with a plain text editor NOT MSWord. I use Notepad for this. Start Notepad then Open a file.
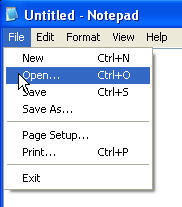
We determined the location of the proper file just a bit ago so we would know exactly where to find the file.
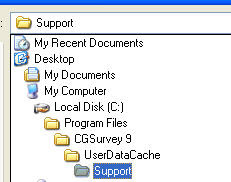
Again, users of other versions of the software might find a slightly different name. This is the name of the file in CG Survey 9. If you don't see the file there check to see that Notepad is looking for all file types and not just text files.
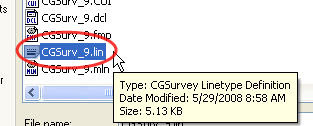
Pay particular attention to any text in the file that is proceeded by two semi colons. This text is where the programmers leave users important information.
In this case we find a note telling us to make any changes need to be saved to the end of the file.

This must be an important message because here it is again.

Go to the end of the file and add these two lines of text. It should be fine to copy and paste from this post
*Major-Utility-Line
A,1,-.1,["T",Map_Symbols,s=.12,x=-.05,y=-.06],-.1
I know we covered this before, but lets take a moment or two to go over again exactly what this text means.


You see now why we created the Text Style called Map_Symbols. Without that, this line definition won't look right.


I'm sure many (most?) of you will want to tinker with the various parts of the line definition to get the line looking exactly like what you have in mind. This should give you the information you need to do that.
Save the line definitions file and close Notepad.
Now you have to load the new line definition into your drawing.
Go to the Format Pulldown menu and choose Linetype.

From the Linetype Manager Dialog box choose the Load button.

Choose the File button.

Find the proper linetype file.
Highlight the linetype name "Major-Utility-Line" 1
choose OK. 2
Highlight the linetype name "Major-Utility-Line" 1
choose OK. 2

Your new line type should now be a part of your drawing.

In a later tutorial I'll talk about how you save this file type to your prototype drawing so it is available when you open the program.
Larry P


