Trust me it sounds harder than it is. Let me show you how.
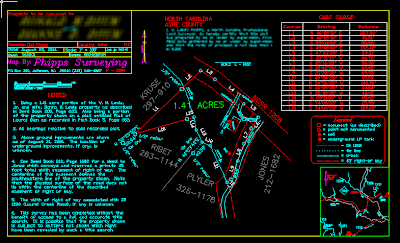
Figure 1 is a screen cap of a fairly typical map from my files.
Figure 1.
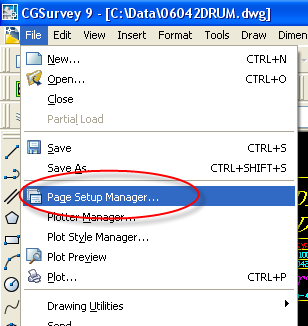
When preparing a version to share with clients (at least those without AutoCAD) we start by creating a new Page Setup. Do this by going to File>Page Setup Manager
Figure 2.
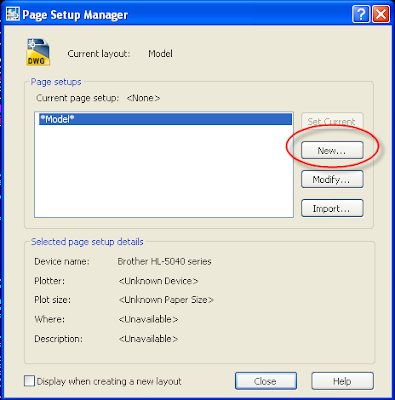
This will bring up the Page Setup Manager dialog box. We want to create a New Page Setup
Figure 3.
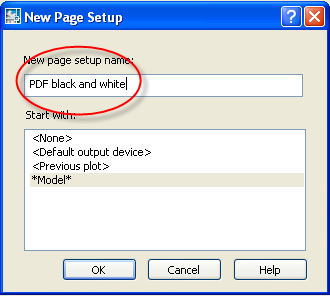
The New Page Setup Dialog box allows us to name our new Page Setup. I'm going to call mine PDF black and white. (Quick side note: I strongly encourage users to use names that are descriptive.)
Figure 4.
There are several options to be set when the Page Setup dialog box appears. Let's focus on just those involved with printing in color or black and white. (If my readers want more on Page Setups just let me know.)
First, we see that the current color table is set to a file called Phipps_Survey_b-w.ctb. To edit that table we click the icon just to the right of the color table name.
Figure 5.

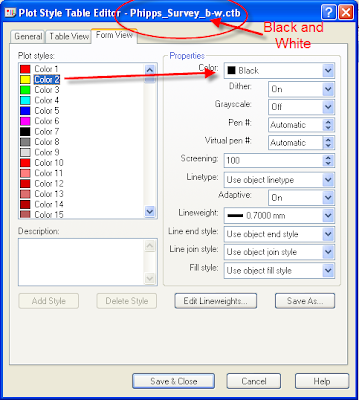
The Plot Style Table Editor box tells us the name of the file being edited at the top (in this case Phipps_Survey_b-w.ctb)
Here we see Color 2 is set to print in Black.
Figure 6.
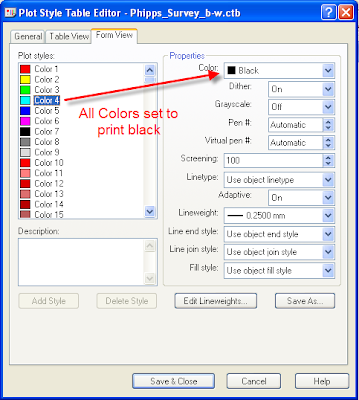
Here we see Color 4 was set to print in Black. This particular table, because it is a black and white table should have all colors set to Black.
Figure 7.
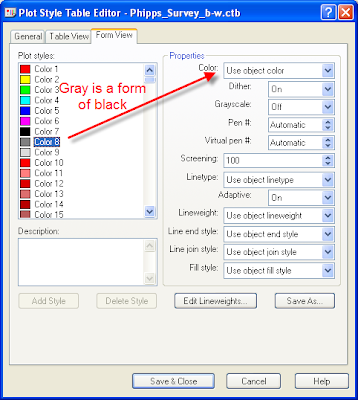
 Well, almost all the colors are set to Black. I actually keep the gray colors gray. Turns out Gray is a perfectly valid color even on a black and white printer. Plus, I've found that using Gray for certain items can be quite useful.
Figure 8.
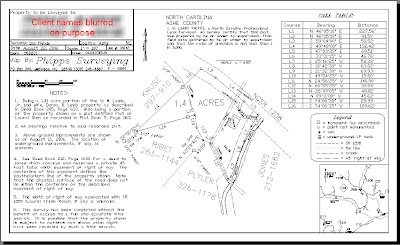
Here we see a preview of the map as it will look when the file is created. (Except where I modified the image to blur the client names.)
Figure 9.
 Ok, so how do we do color? I'm glad you asked.
I've gone back to my Page Setup Manager and created a Page Setup named PDF partial color. By default, the black and white color table (Phipps Survey_b-w.ctb) is current. Edit that table by left mouse click on the icon next to the table name.
Figure 10.

Turns out the creek in my map is drawn using Color 130. To plot all items drawn using Color 130 in color, we edit the Color Table. Set Color 130 to use object color. Then save the table with a new name.
Figure 11.

When the Save As dialog box comes up be sure and use a name that is descriptive. You should be able to tell at a glance exactly what the table does for you. In this case I use Phipps_Survey_part color.ctb.
Figure 12.
 Once this table has been saved we will be returned to the Page Setup dialog box.
We've done Step 1 (Create the new setup). Step 2 is to assign the new Phipps_Survey_part color.ctb as the active color table for this page setup.
Figure 13.

When we left click on OK to finish creating this Plot Style we will be asked if we wish to assign the table to all layouts. For most users the answer will be yes. (Advanced users who need to say No will know.)
Figure 14.
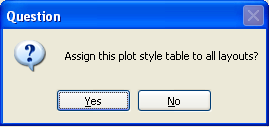 When we preview the file we see the creek is now plotted using Color 130.
Figure 15.
 That is good; but, it's not the whole story. Some colors work well on a computer monitor but not so well on paper or in a pdf file. Colors with a high yellow content can be very difficult to see on paper.
The good news is we do not have to stick with the color we drew on the screen. In fact you can edit your color table to plot any other color you wish. Here we see I've edited my part color table to plot in Red.
Figure 16.

This preview shows the creek is now drawn in Red. If we looked on the screen at the drawing we wouldn't see any difference in the file. The Red only shows up when we use the use the Plot Style to "print" the map.
Figure 17.

Finally, if we go back to our color table, we can create a full color table by selecting all the colors from the Plot styles shown on the left, then assigning all the colors to plot using the object color. Be sure and use the Save As function with a name that makes sense.
Figure 18.

As you can see, I use a file name that includes my company name and the fact that this table plots using full color.
Figure 19.

We now have 3 color tables from which we can choose depending our needs.
Figure 20.

Along the way I saved each Page Setup to this drawing. Each Setup has been named so I can tell it's purpose at a glance.
Figure 21.

That covers the basics. If anyone has specific questions they'd like answered, send me an email and I'll see what I can do.
Larry P


No comments:
Post a Comment