The next version of C&G is now available for download from the Carlson Download page**.
This newest version (CG 19) works with your existing seat of AutoCAD or installs an Intellicad engine.
I've been on the road for the past week +. So far I've not had a chance to install and check out this version. Hope to have a proper review later this week.
For anyone who wants to check it out, give me a call at the office and I'll get you a demo serial number.
Larry P
800-533-4387
** Choose the CGSurvey for Autocad and CGSurvey 19 options
Sunday, October 19, 2008
Wednesday, October 8, 2008
Using Color Tables
I've found that helping people understand complex maps is much easier with the liberal use of color. I don't mean color on your computer monitor. We all have that. I mean color on paper.
Trust me it sounds harder than it is. Let me show you how.
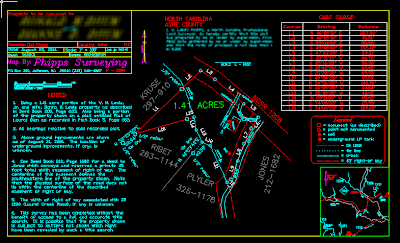
Figure 1 is a screen cap of a fairly typical map from my files.
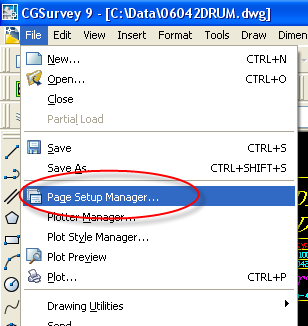
When preparing a version to share with clients (at least those without AutoCAD) we start by creating a new Page Setup. Do this by going to File>Page Setup Manager
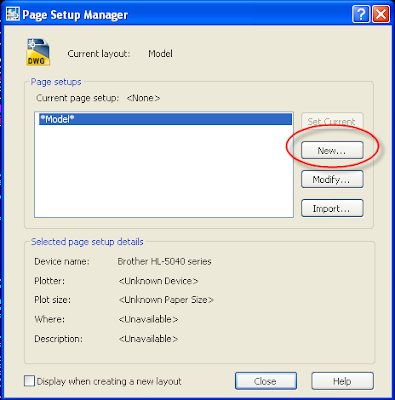
This will bring up the Page Setup Manager dialog box. We want to create a New Page Setup
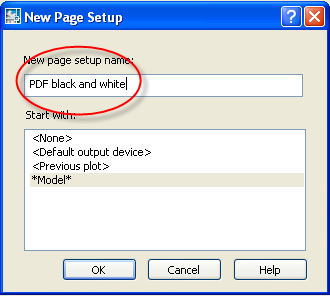
The New Page Setup Dialog box allows us to name our new Page Setup. I'm going to call mine PDF black and white. (Quick side note: I strongly encourage users to use names that are descriptive.)
There are several options to be set when the Page Setup dialog box appears. Let's focus on just those involved with printing in color or black and white. (If my readers want more on Page Setups just let me know.)
First, we see that the current color table is set to a file called Phipps_Survey_b-w.ctb. To edit that table we click the icon just to the right of the color table name.

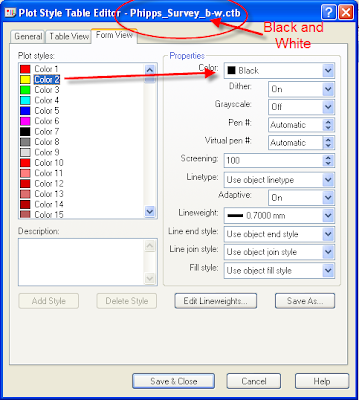
The Plot Style Table Editor box tells us the name of the file being edited at the top (in this case Phipps_Survey_b-w.ctb)
Here we see Color 2 is set to print in Black.
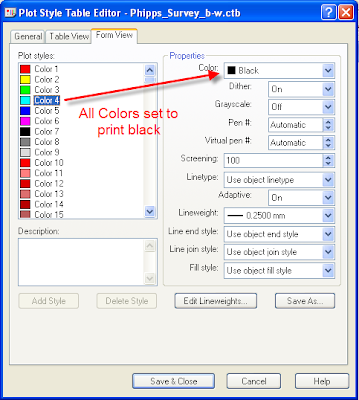
Here we see Color 4 was set to print in Black. This particular table, because it is a black and white table should have all colors set to Black.
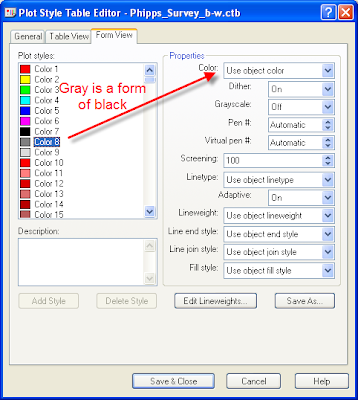
 Well, almost all the colors are set to Black. I actually keep the gray colors gray. Turns out Gray is a perfectly valid color even on a black and white printer. Plus, I've found that using Gray for certain items can be quite useful.
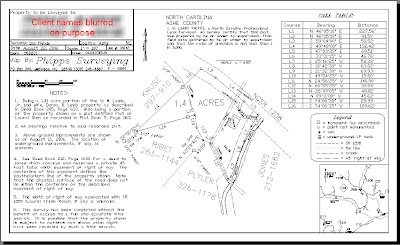
Here we see a preview of the map as it will look when the file is created. (Except where I modified the image to blur the client names.)
 Ok, so how do we do color? I'm glad you asked.
I've gone back to my Page Setup Manager and created a Page Setup named PDF partial color. By default, the black and white color table (Phipps Survey_b-w.ctb) is current. Edit that table by left mouse click on the icon next to the table name.

Turns out the creek in my map is drawn using Color 130. To plot all items drawn using Color 130 in color, we edit the Color Table. Set Color 130 to use object color. Then save the table with a new name.

When the Save As dialog box comes up be sure and use a name that is descriptive. You should be able to tell at a glance exactly what the table does for you. In this case I use Phipps_Survey_part color.ctb.
 Once this table has been saved we will be returned to the Page Setup dialog box.
We've done Step 1 (Create the new setup). Step 2 is to assign the new Phipps_Survey_part color.ctb as the active color table for this page setup.

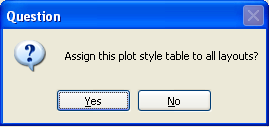
When we left click on OK to finish creating this Plot Style we will be asked if we wish to assign the table to all layouts. For most users the answer will be yes. (Advanced users who need to say No will know.)
 When we preview the file we see the creek is now plotted using Color 130.
 That is good; but, it's not the whole story. Some colors work well on a computer monitor but not so well on paper or in a pdf file. Colors with a high yellow content can be very difficult to see on paper.
The good news is we do not have to stick with the color we drew on the screen. In fact you can edit your color table to plot any other color you wish. Here we see I've edited my part color table to plot in Red.

This preview shows the creek is now drawn in Red. If we looked on the screen at the drawing we wouldn't see any difference in the file. The Red only shows up when we use the use the Plot Style to "print" the map.

Finally, if we go back to our color table, we can create a full color table by selecting all the colors from the Plot styles shown on the left, then assigning all the colors to plot using the object color. Be sure and use the Save As function with a name that makes sense.

As you can see, I use a file name that includes my company name and the fact that this table plots using full color.

We now have 3 color tables from which we can choose depending our needs.

Along the way I saved each Page Setup to this drawing. Each Setup has been named so I can tell it's purpose at a glance.

That covers the basics. If anyone has specific questions they'd like answered, send me an email and I'll see what I can do.
Larry P
Trust me it sounds harder than it is. Let me show you how.
Figure 1 is a screen cap of a fairly typical map from my files.
Figure 1.

When preparing a version to share with clients (at least those without AutoCAD) we start by creating a new Page Setup. Do this by going to File>Page Setup Manager
Figure 2.

This will bring up the Page Setup Manager dialog box. We want to create a New Page Setup
Figure 3.

The New Page Setup Dialog box allows us to name our new Page Setup. I'm going to call mine PDF black and white. (Quick side note: I strongly encourage users to use names that are descriptive.)
Figure 4.

There are several options to be set when the Page Setup dialog box appears. Let's focus on just those involved with printing in color or black and white. (If my readers want more on Page Setups just let me know.)
First, we see that the current color table is set to a file called Phipps_Survey_b-w.ctb. To edit that table we click the icon just to the right of the color table name.
Figure 5.

The Plot Style Table Editor box tells us the name of the file being edited at the top (in this case Phipps_Survey_b-w.ctb)
Here we see Color 2 is set to print in Black.
Figure 6.

Here we see Color 4 was set to print in Black. This particular table, because it is a black and white table should have all colors set to Black.
Figure 7.
 Well, almost all the colors are set to Black. I actually keep the gray colors gray. Turns out Gray is a perfectly valid color even on a black and white printer. Plus, I've found that using Gray for certain items can be quite useful.
Figure 8.

Here we see a preview of the map as it will look when the file is created. (Except where I modified the image to blur the client names.)
Figure 9.
 Ok, so how do we do color? I'm glad you asked.
I've gone back to my Page Setup Manager and created a Page Setup named PDF partial color. By default, the black and white color table (Phipps Survey_b-w.ctb) is current. Edit that table by left mouse click on the icon next to the table name.
Figure 10.

Turns out the creek in my map is drawn using Color 130. To plot all items drawn using Color 130 in color, we edit the Color Table. Set Color 130 to use object color. Then save the table with a new name.
Figure 11.

When the Save As dialog box comes up be sure and use a name that is descriptive. You should be able to tell at a glance exactly what the table does for you. In this case I use Phipps_Survey_part color.ctb.
Figure 12.
 Once this table has been saved we will be returned to the Page Setup dialog box.
We've done Step 1 (Create the new setup). Step 2 is to assign the new Phipps_Survey_part color.ctb as the active color table for this page setup.
Figure 13.

When we left click on OK to finish creating this Plot Style we will be asked if we wish to assign the table to all layouts. For most users the answer will be yes. (Advanced users who need to say No will know.)
Figure 14.
 When we preview the file we see the creek is now plotted using Color 130.
Figure 15.
 That is good; but, it's not the whole story. Some colors work well on a computer monitor but not so well on paper or in a pdf file. Colors with a high yellow content can be very difficult to see on paper.
The good news is we do not have to stick with the color we drew on the screen. In fact you can edit your color table to plot any other color you wish. Here we see I've edited my part color table to plot in Red.
Figure 16.

This preview shows the creek is now drawn in Red. If we looked on the screen at the drawing we wouldn't see any difference in the file. The Red only shows up when we use the use the Plot Style to "print" the map.
Figure 17.

Finally, if we go back to our color table, we can create a full color table by selecting all the colors from the Plot styles shown on the left, then assigning all the colors to plot using the object color. Be sure and use the Save As function with a name that makes sense.
Figure 18.

As you can see, I use a file name that includes my company name and the fact that this table plots using full color.
Figure 19.

We now have 3 color tables from which we can choose depending our needs.
Figure 20.

Along the way I saved each Page Setup to this drawing. Each Setup has been named so I can tell it's purpose at a glance.
Figure 21.

That covers the basics. If anyone has specific questions they'd like answered, send me an email and I'll see what I can do.
Larry P
Saturday, September 27, 2008
Inserting a Block into your default template
This time let's talk about inserting a block into your drawing template.
There are two Phases to this operation. Phase I involves getting the block into a drawing. For Phase II we save that drawing as our template.
__________________________
Phase I
We begin by starting C&G then going to the Insert > Block Menu. It is important you use a fresh Drawing1.dwg.
This action opens the Insert Block Dialog Box.
The Name field shows blocks which are already in your drawing. (To see a list of all the blocks in the drawing choose the choices button to the left of the name field.)
If you saved the drawing with a preview button you will be able to preview the image in the upper right corner of the dialog box.
Because we want to add a block that is not already part of the drawing we choose the Browse Button.
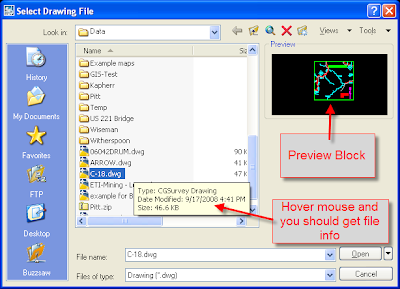
Choosing Browse Opens the Select Drawing File dialog box. We then navigate to the appropriate location and choose the drawing to insert as a block. In this example we will insert a drawing called C-18.dwg
We choose C-18 by using your mouse to left click on the name from the list of drawings stored in the active folder. If we left click once we see a preview in the upper left of the dialog box. We can also hover our mouse and (depending on your system settings) we will see an information box appear. When we are satisfied this is the file we want, we can double left click the file name or we can left click once then move the mouse down to the lower left and click open.
"Opening" the drawing will take us back to our drawing. The block will be on your cursor. You can move your mouse to place the block.
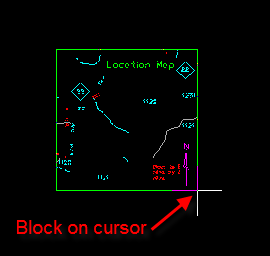
In this case however, do not do that. Instead, use the escape key to stop placing the block. Even though you did not place the block on the screen it is now part of the drawing.
_____________________
Phase II
Now that we have the block in Drawing1.dwg we want to make that our default template.
Here is how we do that.
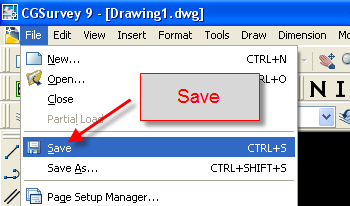
From the Pull down menu go to File >Save. (You can use the keyboard shortcut or toolbar icon if you wish as either of those will get exactly the same result.)
 Executing this command brings up the Save Drawing As dialog box. (Note that this box only appears the first time you save a drawing. If you have a drawing that has already been saved and wish to save a copy you should use the File>Save As command.)
By default the Save As dialog box will save the drawing as a standard AutoCAD drawing file. This means you get a dwg file type. But that is not what we want.

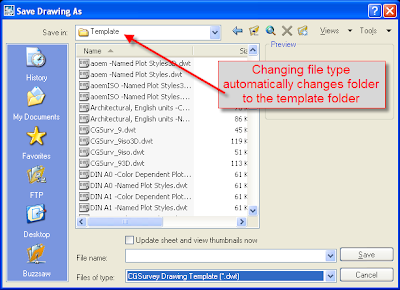
We want to save our drawing as a template. So we have to change the file type shown at the bottom of the dialog box. We want to save as an AutoCAD template. Template files have a dwt extension.

When we change the Files of Type box to dwt the program automatically changes the current folder to the template storage folder.
For CG 9 the default template is named CGSurv_9.dwt. (For CG 8 the default template name is CGSurv_8.dwt. For CG 7 the default is CGSu.dwt.)
Locate your default template and either double left click the file name or left click once then left click open.
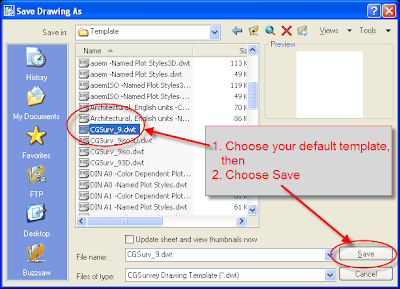
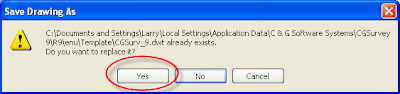
When you save a file with the same name as a file that already exists, you will get a warning box asking if you want to overwrite the existing file. In this case we do so choose Yes.
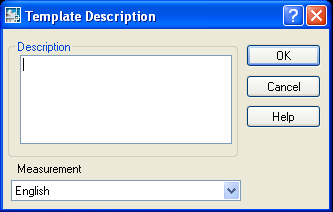
Next, we get a Template Description Dialog Box. If you wish you can type a detailed description of the template and what it is designed to do. Or, if you wish you can leave the box blank. Either way this box provides input to the user and will not in any way affect your actual drawings. When you finish typing (or not typing) left click Ok.
Your block is now a part of the drawing. To check you can go to the Insert>Block menu for confirmation.

If you wish to make other changes to your template now is a good opportunity to do so.
When you have finished making those changes, I recommend closing then restarting
the program.
I will get into more details concerning blocks in a future post. Please subscribe to my blog feed or check back regularly.
Larry P
There are two Phases to this operation. Phase I involves getting the block into a drawing. For Phase II we save that drawing as our template.
__________________________
Phase I
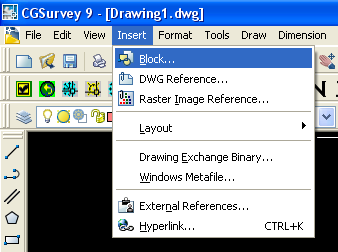
We begin by starting C&G then going to the Insert > Block Menu. It is important you use a fresh Drawing1.dwg.
Figure 1.

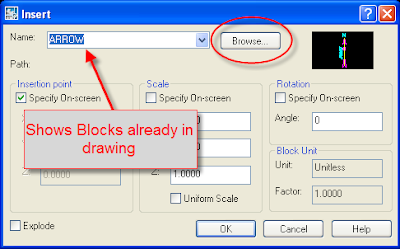
This action opens the Insert Block Dialog Box.
The Name field shows blocks which are already in your drawing. (To see a list of all the blocks in the drawing choose the choices button to the left of the name field.)
If you saved the drawing with a preview button you will be able to preview the image in the upper right corner of the dialog box.
Because we want to add a block that is not already part of the drawing we choose the Browse Button.
Figure 2.

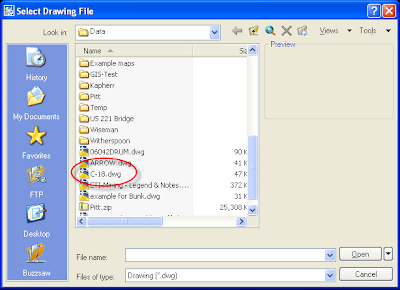
Choosing Browse Opens the Select Drawing File dialog box. We then navigate to the appropriate location and choose the drawing to insert as a block. In this example we will insert a drawing called C-18.dwg
Figure 3.

We choose C-18 by using your mouse to left click on the name from the list of drawings stored in the active folder. If we left click once we see a preview in the upper left of the dialog box. We can also hover our mouse and (depending on your system settings) we will see an information box appear. When we are satisfied this is the file we want, we can double left click the file name or we can left click once then move the mouse down to the lower left and click open.
Figure 4.

"Opening" the drawing will take us back to our drawing. The block will be on your cursor. You can move your mouse to place the block.
Figure 5.

In this case however, do not do that. Instead, use the escape key to stop placing the block. Even though you did not place the block on the screen it is now part of the drawing.
_____________________
Phase II
Now that we have the block in Drawing1.dwg we want to make that our default template.
Here is how we do that.
From the Pull down menu go to File >Save. (You can use the keyboard shortcut or toolbar icon if you wish as either of those will get exactly the same result.)
Figure 6.
 Executing this command brings up the Save Drawing As dialog box. (Note that this box only appears the first time you save a drawing. If you have a drawing that has already been saved and wish to save a copy you should use the File>Save As command.)
By default the Save As dialog box will save the drawing as a standard AutoCAD drawing file. This means you get a dwg file type. But that is not what we want.
Figure 7.

We want to save our drawing as a template. So we have to change the file type shown at the bottom of the dialog box. We want to save as an AutoCAD template. Template files have a dwt extension.
Figure 8.

When we change the Files of Type box to dwt the program automatically changes the current folder to the template storage folder.
Figure 9.

For CG 9 the default template is named CGSurv_9.dwt. (For CG 8 the default template name is CGSurv_8.dwt. For CG 7 the default is CGSu.dwt.)
Locate your default template and either double left click the file name or left click once then left click open.
Figure 10.

When you save a file with the same name as a file that already exists, you will get a warning box asking if you want to overwrite the existing file. In this case we do so choose Yes.
Figure 11.

Next, we get a Template Description Dialog Box. If you wish you can type a detailed description of the template and what it is designed to do. Or, if you wish you can leave the box blank. Either way this box provides input to the user and will not in any way affect your actual drawings. When you finish typing (or not typing) left click Ok.
Figure 12.

Your block is now a part of the drawing. To check you can go to the Insert>Block menu for confirmation.
Figure 13.

If you wish to make other changes to your template now is a good opportunity to do so.
When you have finished making those changes, I recommend closing then restarting
the program.
I will get into more details concerning blocks in a future post. Please subscribe to my blog feed or check back regularly.
Larry P
Sunday, August 24, 2008
Converting Old Dos Drawings
On thing that concerns (or should concern) long term users of C&G surveying software is the ability to use older versions of drawings, coordinate files, point groups and raw data files. There is good news for those concerned about accessibility of older files.
For the past several versions C&G has included the ability to convert the old PL files to dwg files. The process is really easy and fairly quick. Before I show you how the process works, I do want to issue a word of warning. When you convert a PL file, a new dwg will be created with that same name. If you previously had a dwg file with the same name as the original PL file, it will be over written without warning. Be careful when converting these old drawings. You can find yourself losing data when the existing file is over written.
With that warning, let me show you how to convert the old PL files.
Begin by starting the program.
There are two basic steps. First, we must Setup the process. During this setup we define the data path for CG Inserts. CG Inserts from the PL file will converted to CAD Blocks.
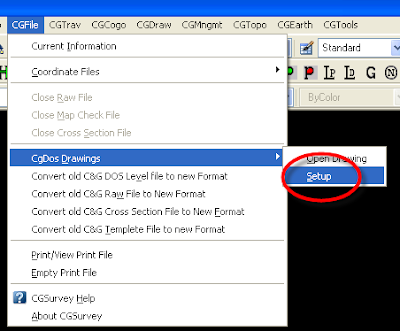
Go to the CGFile pull down menu. Choose CGFile>CGDos Drawings>Setup.
When the CG Dos Drawing conversion Box opens, set the data path for any CG Inserts referenced in the PL file you wish to convert. In this case, the Inserts for our drawing are contained in data path c:\data\95060.
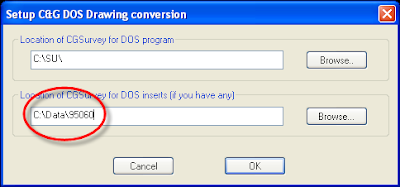
When the data path is properly set, Choose OK.
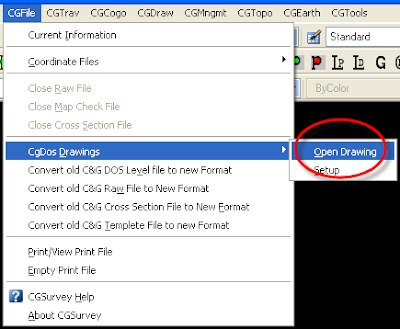
Next we go back to the CGFile pull down menu. Choose CGFile>CGDos Drawings>Open Drawings.
Next we choose the drawing we wish to open.
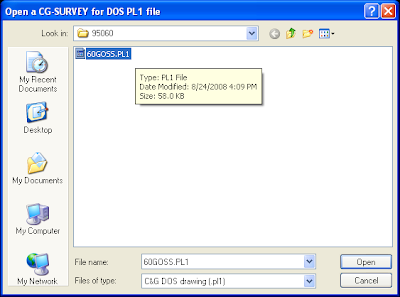
After chosing the file and then Open, the process begins. The time necessary to complete the conversion will vary with the size of the drawing being converted. Simple drawings happen in a few seconds. More complex drawings will take a bit longer. (Even very large drawings should take less than a minute to convert.)
The the drawing layers being converted will show in the command line.
Once complete, the conversion successful dialog box will appear. Note the warning. I always encourage everyone to keep their color and pen width definitions consistant. Doing so will insure your old drawings will look the same as your new drawings and vice versa.
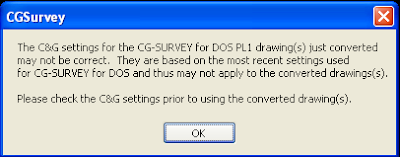
Figure 6 shows the converted drawing. This particular drawing is a realitively simple preliminary drawing. The conversion not perfect. I sometimes have issues converting my title block. This is partly because I used attributes in my DOS drawings.
Also you'll find drawings containing "J" line types won't look the same when converted. (A CG Dos J line type is a double line offset from the center.) These do not convert properly to CAD because until recently AutoCAD did not support double offset lines.
Larry P
For the past several versions C&G has included the ability to convert the old PL files to dwg files. The process is really easy and fairly quick. Before I show you how the process works, I do want to issue a word of warning. When you convert a PL file, a new dwg will be created with that same name. If you previously had a dwg file with the same name as the original PL file, it will be over written without warning. Be careful when converting these old drawings. You can find yourself losing data when the existing file is over written.
With that warning, let me show you how to convert the old PL files.
Begin by starting the program.
There are two basic steps. First, we must Setup the process. During this setup we define the data path for CG Inserts. CG Inserts from the PL file will converted to CAD Blocks.
Go to the CGFile pull down menu. Choose CGFile>CGDos Drawings>Setup.
Figure 1.

When the CG Dos Drawing conversion Box opens, set the data path for any CG Inserts referenced in the PL file you wish to convert. In this case, the Inserts for our drawing are contained in data path c:\data\95060.
Figure 2.

When the data path is properly set, Choose OK.
Next we go back to the CGFile pull down menu. Choose CGFile>CGDos Drawings>Open Drawings.
Figure 3.

Next we choose the drawing we wish to open.
Figure 4.

After chosing the file and then Open, the process begins. The time necessary to complete the conversion will vary with the size of the drawing being converted. Simple drawings happen in a few seconds. More complex drawings will take a bit longer. (Even very large drawings should take less than a minute to convert.)
The the drawing layers being converted will show in the command line.
Once complete, the conversion successful dialog box will appear. Note the warning. I always encourage everyone to keep their color and pen width definitions consistant. Doing so will insure your old drawings will look the same as your new drawings and vice versa.
Figure 5.

Figure 6 shows the converted drawing. This particular drawing is a realitively simple preliminary drawing. The conversion not perfect. I sometimes have issues converting my title block. This is partly because I used attributes in my DOS drawings.
Also you'll find drawings containing "J" line types won't look the same when converted. (A CG Dos J line type is a double line offset from the center.) These do not convert properly to CAD because until recently AutoCAD did not support double offset lines.
Figure 6.

Larry P
Saturday, August 16, 2008
Draw Mapcheck and Input Scale Factor
I want to touch on a couple of topics with this post. One is a way to take a deed description written in units other than feet (or meters). The other function I want to highlight is new to CG Survey 9. The Draw Mapcheck function.
Let's start with a deed written in poles. (One pole equal 16.5 feet). Figure 1 shows a fairly typical Mapcheck file from my records.
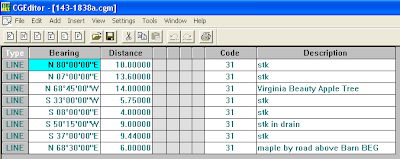
Notice the distance units I have in the Mapcheck file. The first deed distance is 10 poles. Insert each distance just as it appears in the deed.
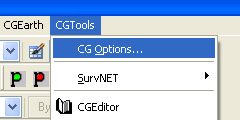
Close the Mapcheck file and go to the CG Tools> CG Options Pull down menu. (Figure 2.)
In the CG Options Dialog box you will find the Scale Factor Options in the lower left.
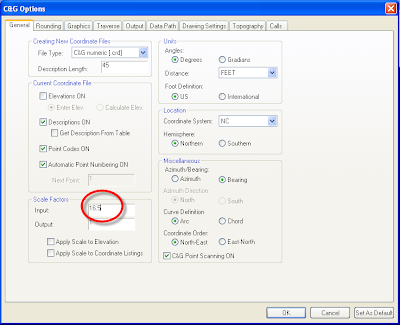
Since we know 1 pole = 16.5 we change the Input Scale Factor to 16.5. Close the CG Options Dialog box by choosing the OK button at the bottom. (If you close the dialog box by clicking the red x in the upper right your changes will not be saved.)
Next let's take a look at the Draw Mapcheck function.
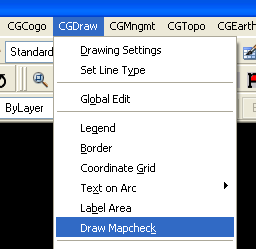
Go to the CG Draw > Draw Mapcheck function.
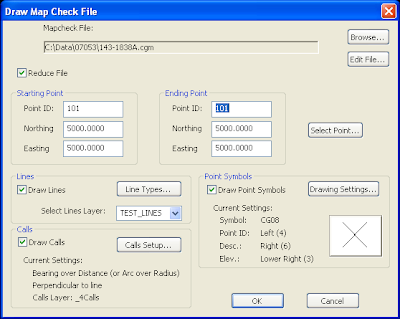
The Draw Mapcheck dialog box allows us to do many things. At the top of the box you see we have to choose exactly which Mapcheck file we wish to work with. If needed, we can even edit the file by choosing the Edit File button.
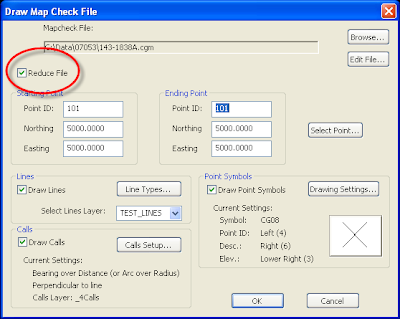
We have control of all the elements of a map. We can reduce the Mapcheck file to coordinates. We choose the starting and ending point numbers as well as coordinates for those points. See Figure 6.
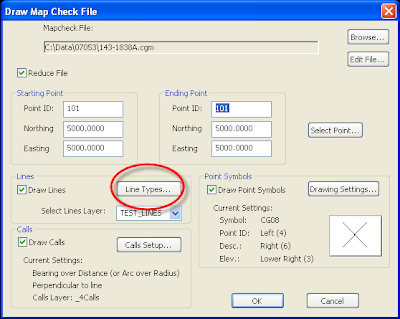
We can change the line type to be used. See Figure 7. If the line type you wish to use is not a part of the current drawing you can even add the type from a linetype file. See this post and this post for more details on linetype files.
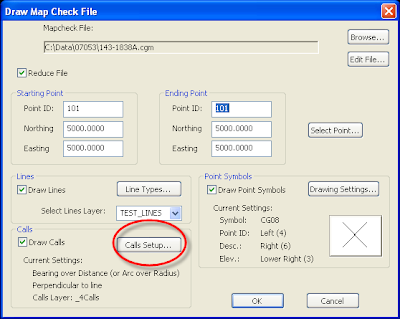
If we wish to draw calls on our map we can use the Calls Setup button to set them as we wish. See Figure 8.
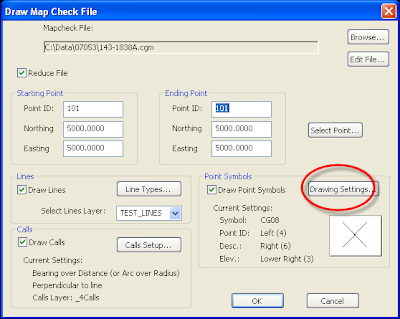
You change the point symbol and annotation settings by choosing the Drawing Settings button. See Figure 9.
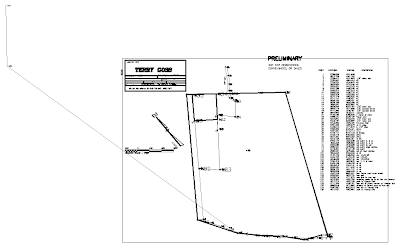
Once we have all our options set, choose the OK button. Your map is drawn and annotated per your choices. See Figure 10.
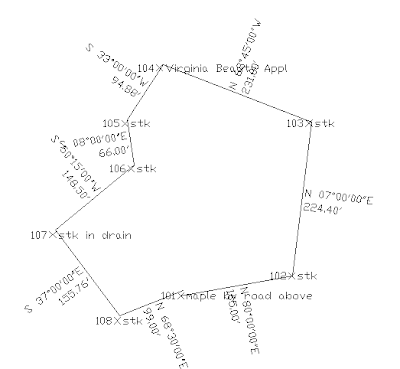
Certainly this quick sketch is not ready to hand to a client; but, it does show you can quickly get data on the sheet. Minor moving of calls or point descriptions are easy at that point. Also note that our distances are shown in feet. The magic of the Input Scale Factor has converted the distances for us.
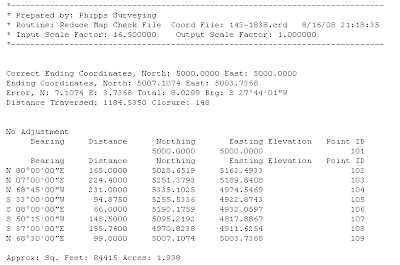
Finally, if we look at the reduced data we see the closure report and that the coordinates are correctly calculated in feet. See Figure 11.
Larry P
Let's start with a deed written in poles. (One pole equal 16.5 feet). Figure 1 shows a fairly typical Mapcheck file from my records.
Figure 1.

Notice the distance units I have in the Mapcheck file. The first deed distance is 10 poles. Insert each distance just as it appears in the deed.
Close the Mapcheck file and go to the CG Tools> CG Options Pull down menu. (Figure 2.)
Figure 2.

In the CG Options Dialog box you will find the Scale Factor Options in the lower left.
Figure 3.

Since we know 1 pole = 16.5 we change the Input Scale Factor to 16.5. Close the CG Options Dialog box by choosing the OK button at the bottom. (If you close the dialog box by clicking the red x in the upper right your changes will not be saved.)
Next let's take a look at the Draw Mapcheck function.
Go to the CG Draw > Draw Mapcheck function.
Figure 4.

The Draw Mapcheck dialog box allows us to do many things. At the top of the box you see we have to choose exactly which Mapcheck file we wish to work with. If needed, we can even edit the file by choosing the Edit File button.
Figure 5.

We have control of all the elements of a map. We can reduce the Mapcheck file to coordinates. We choose the starting and ending point numbers as well as coordinates for those points. See Figure 6.
Figure 6.

We can change the line type to be used. See Figure 7. If the line type you wish to use is not a part of the current drawing you can even add the type from a linetype file. See this post and this post for more details on linetype files.
Figure 7.

If we wish to draw calls on our map we can use the Calls Setup button to set them as we wish. See Figure 8.
Figure 8.

You change the point symbol and annotation settings by choosing the Drawing Settings button. See Figure 9.
Figure 9.

Once we have all our options set, choose the OK button. Your map is drawn and annotated per your choices. See Figure 10.
Figure 10.

Certainly this quick sketch is not ready to hand to a client; but, it does show you can quickly get data on the sheet. Minor moving of calls or point descriptions are easy at that point. Also note that our distances are shown in feet. The magic of the Input Scale Factor has converted the distances for us.
Finally, if we look at the reduced data we see the closure report and that the coordinates are correctly calculated in feet. See Figure 11.
Figure 11.

Larry P
Subscribe to:
Posts (Atom)

