Let's start with a deed written in poles. (One pole equal 16.5 feet). Figure 1 shows a fairly typical Mapcheck file from my records.
Figure 1.
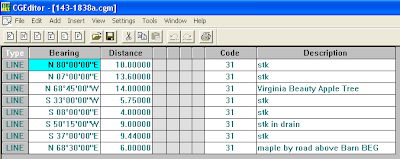
Notice the distance units I have in the Mapcheck file. The first deed distance is 10 poles. Insert each distance just as it appears in the deed.
Close the Mapcheck file and go to the CG Tools> CG Options Pull down menu. (Figure 2.)
Figure 2.
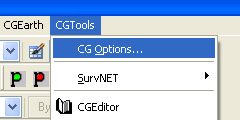
In the CG Options Dialog box you will find the Scale Factor Options in the lower left.
Figure 3.
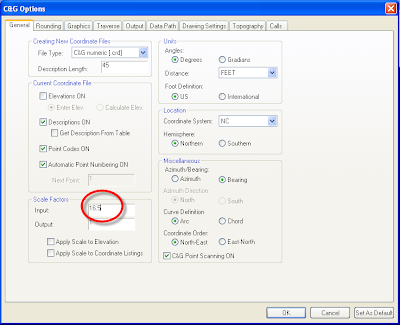
Since we know 1 pole = 16.5 we change the Input Scale Factor to 16.5. Close the CG Options Dialog box by choosing the OK button at the bottom. (If you close the dialog box by clicking the red x in the upper right your changes will not be saved.)
Next let's take a look at the Draw Mapcheck function.
Go to the CG Draw > Draw Mapcheck function.
Figure 4.
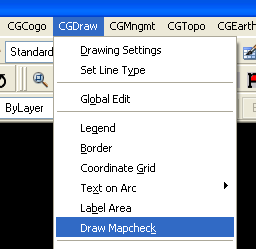
The Draw Mapcheck dialog box allows us to do many things. At the top of the box you see we have to choose exactly which Mapcheck file we wish to work with. If needed, we can even edit the file by choosing the Edit File button.
Figure 5.
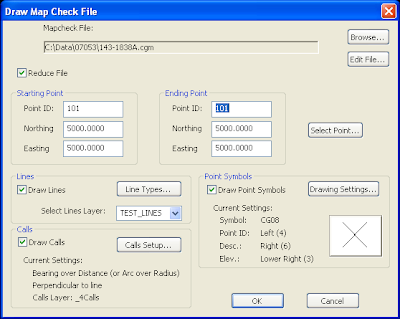
We have control of all the elements of a map. We can reduce the Mapcheck file to coordinates. We choose the starting and ending point numbers as well as coordinates for those points. See Figure 6.
Figure 6.
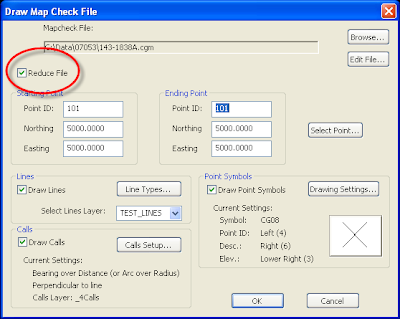
We can change the line type to be used. See Figure 7. If the line type you wish to use is not a part of the current drawing you can even add the type from a linetype file. See this post and this post for more details on linetype files.
Figure 7.
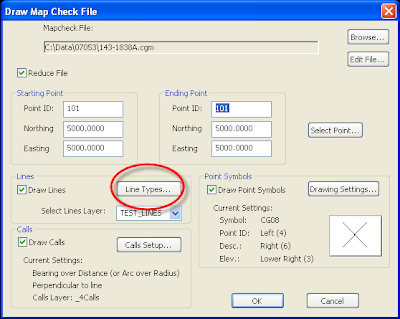
If we wish to draw calls on our map we can use the Calls Setup button to set them as we wish. See Figure 8.
Figure 8.
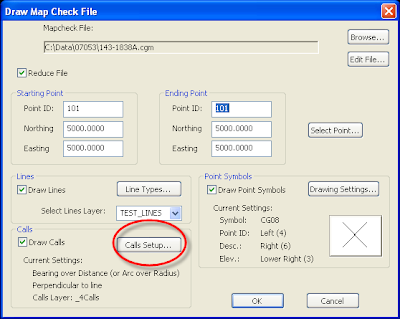
You change the point symbol and annotation settings by choosing the Drawing Settings button. See Figure 9.
Figure 9.
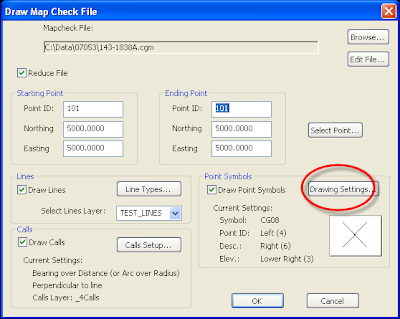
Once we have all our options set, choose the OK button. Your map is drawn and annotated per your choices. See Figure 10.
Figure 10.
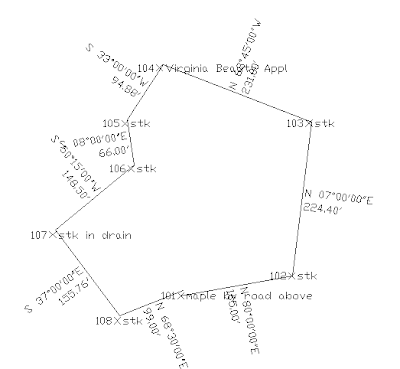
Certainly this quick sketch is not ready to hand to a client; but, it does show you can quickly get data on the sheet. Minor moving of calls or point descriptions are easy at that point. Also note that our distances are shown in feet. The magic of the Input Scale Factor has converted the distances for us.
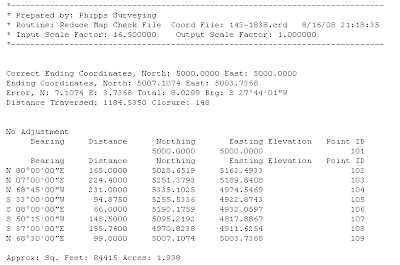
Finally, if we look at the reduced data we see the closure report and that the coordinates are correctly calculated in feet. See Figure 11.
Figure 11.
Larry P


No comments:
Post a Comment